YoY and Quarterly Trend Reporting
Most employee engagement tools have quarterly, and at worst, year over year trend reporting. This allows you to go to your dashboard and see how your teams and company are trending at a glance. It can allow you to see if you're improving or declining overall, and it could even show how you trend in each category compared to the last time the survey was taken. Game changer would be a dashboard that showed every response with a historic trend to see how well you're taking and implementing feedback that you could share with people. This is how true buy-in, change, action, and accountability happens with the data.
Comments: 4
Oldest
•
Newest
•
Most likes
•
Fewest likes
-
11 Oct, '24
Joe Kirschbaum AdminHighlighted comment
Diagnose in PI2 currently supports the ability to track XP scores over time. Overall engagement, as well as Job, Manager, People, and Organization scores are all visible to track between XP surveys. This is visible within the sample survey in PI2, but a screenshot has been included to show the visual itself.
Today, this trending is limited to XP surveys alone. Meaning if I run a bi-annual XP I can track trending over time from directly within Diagnose. Over time, we want to extend this trend data to pulse surveys, as well as broaden trend information beyond just the overall scores and get more granular on the ability to see trends for individual managers, teams etc.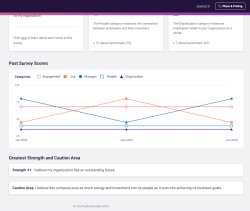
-
01 Feb, '23
Paul CooperThe lack of trending data makes it very cumbersome to try and track how a team/manager/company is progressing over time.
-
07 Oct, '25
Klara SkoglösaAny news on when we will be able to track data over time, on a more detailed level than just category?
So specific, departments, managers etc, but also to be able to track development in specific questions and caution areas?
